
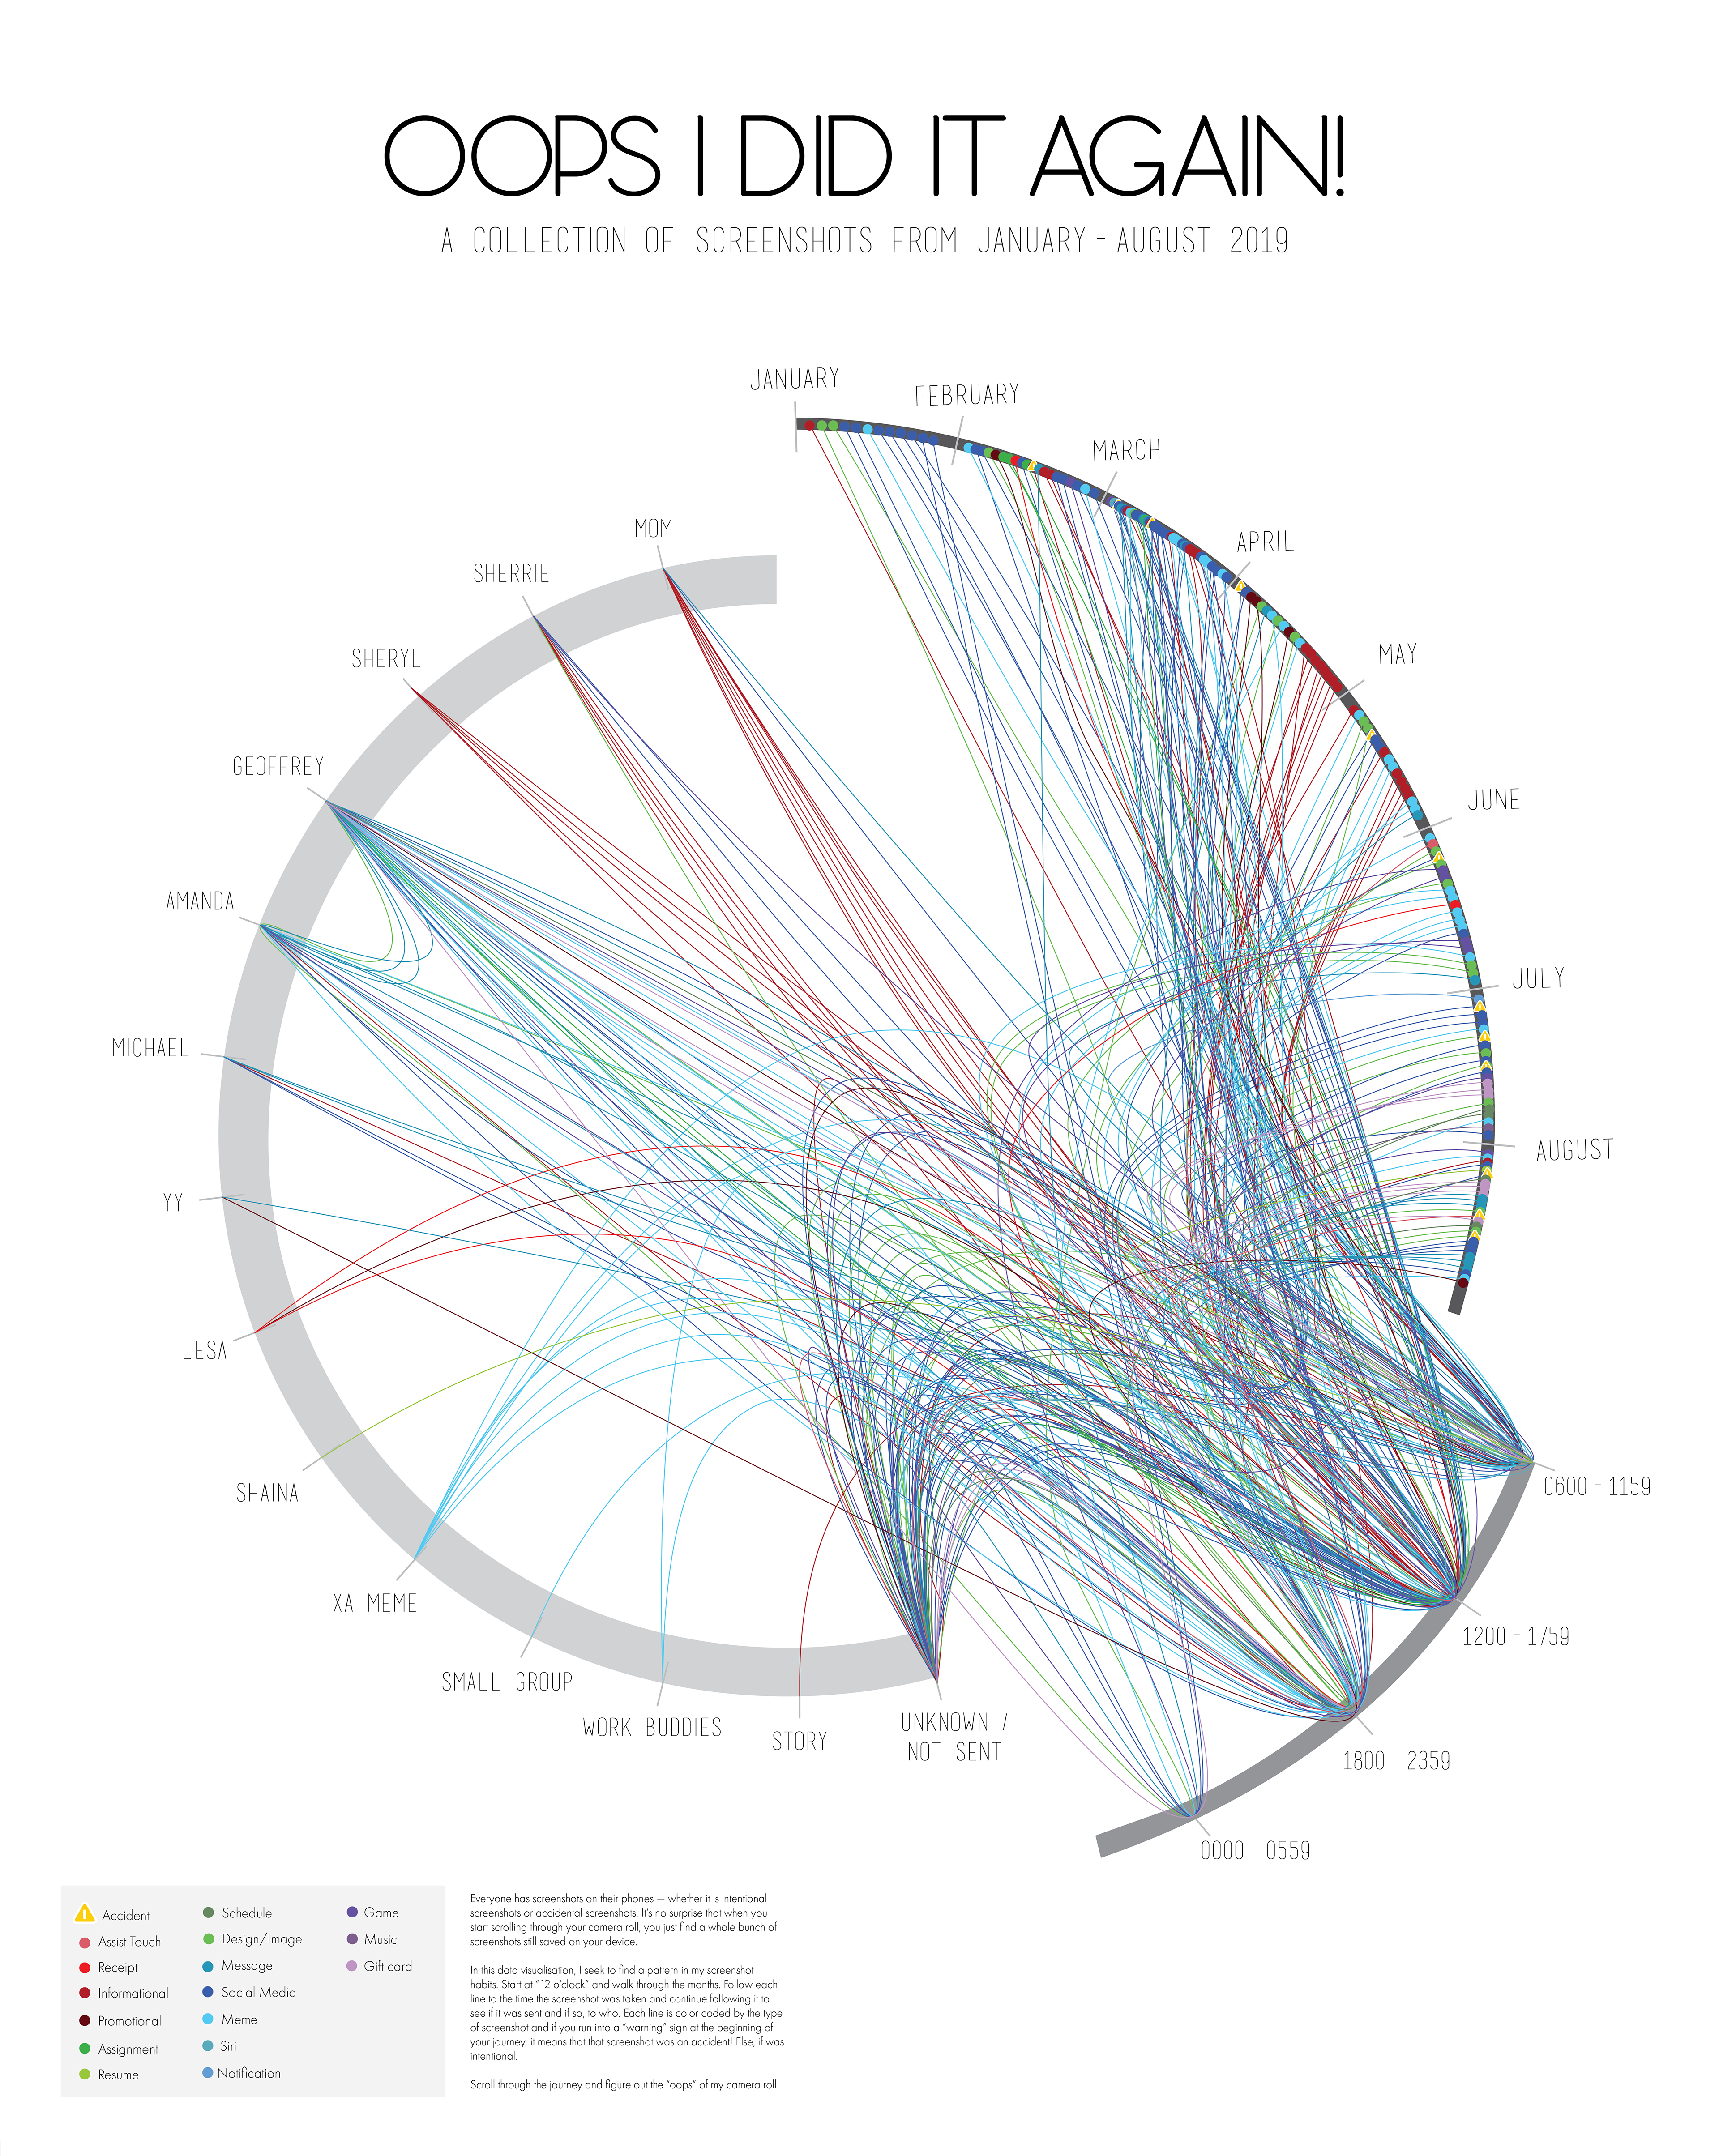
Everyone has screenshots on their phones — whether it is intentional screenshots or accidental screenshots. It’s no surprise that when you start scrolling through your camera roll, you just find a whole bunch of screenshots still saved on your device. In this data visualization, I seek to find a pattern in my screenshot habits. Start at “12 o’clock” and walk through the months. Follow each line to the time the screenshot was taken and continue following it to see if it was sent and if so, to who. Each line is color coded by the type of screenshot and if you run into a “warning” sign at the beginning of your journey, it means that that screenshot was an accident! Else, if was intentional. Scroll through the journey and figure out the “oops” of my camera roll.
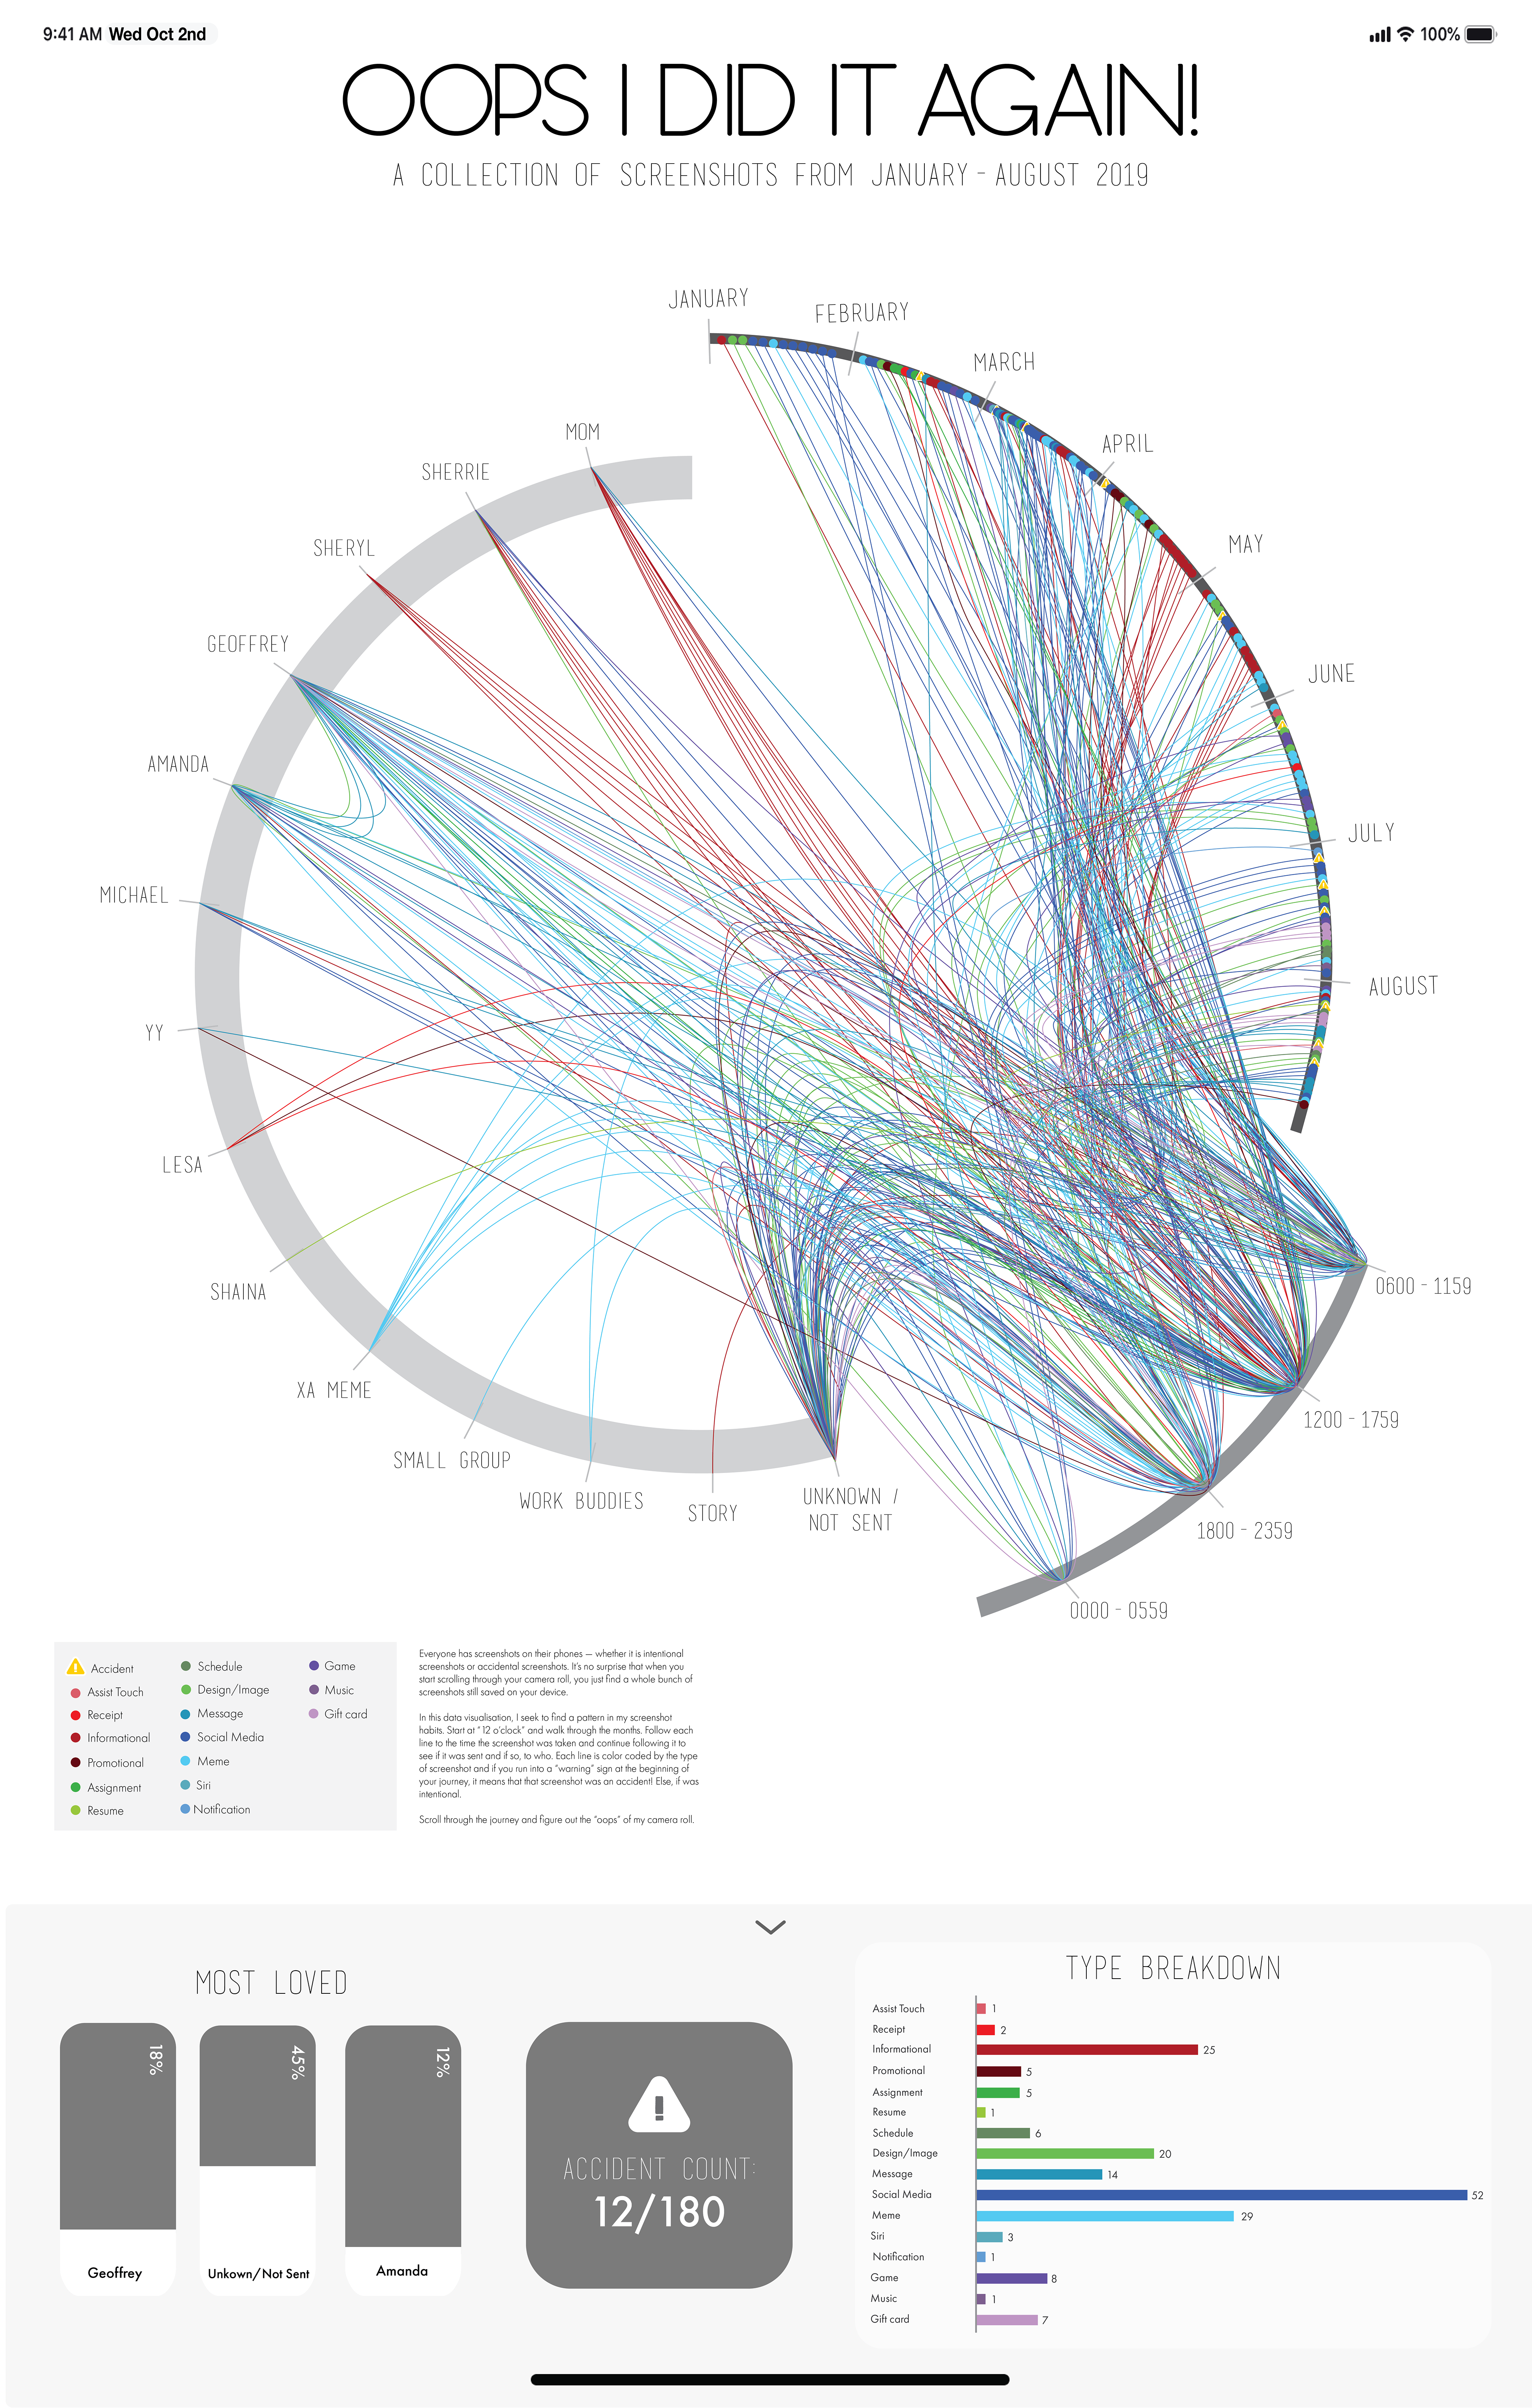
As the number of screenshots and lines can get overwhelming as well. Hence, the data visualization was further broken down into its various screenshot types. The following is a video of how this data visualization could be in an interactive form!